QUICK ANSWER

Wyoming residents drive the most per capita in the United States, averaging over 18,000 miles annually. Other states with high driving rates include Alabama, Mississippi, and New Mexico. Conversely, residents of Washington DC and New York drive the least per capita, largely due to high population density and robust public transportation systems. Driving habits vary significantly based on regional geography, urban development, and local infrastructure. Because more time on the road increases the statistical likelihood of accidents, residents in high mileage states may face higher auto insurance premiums compared to those in states where people drive less.

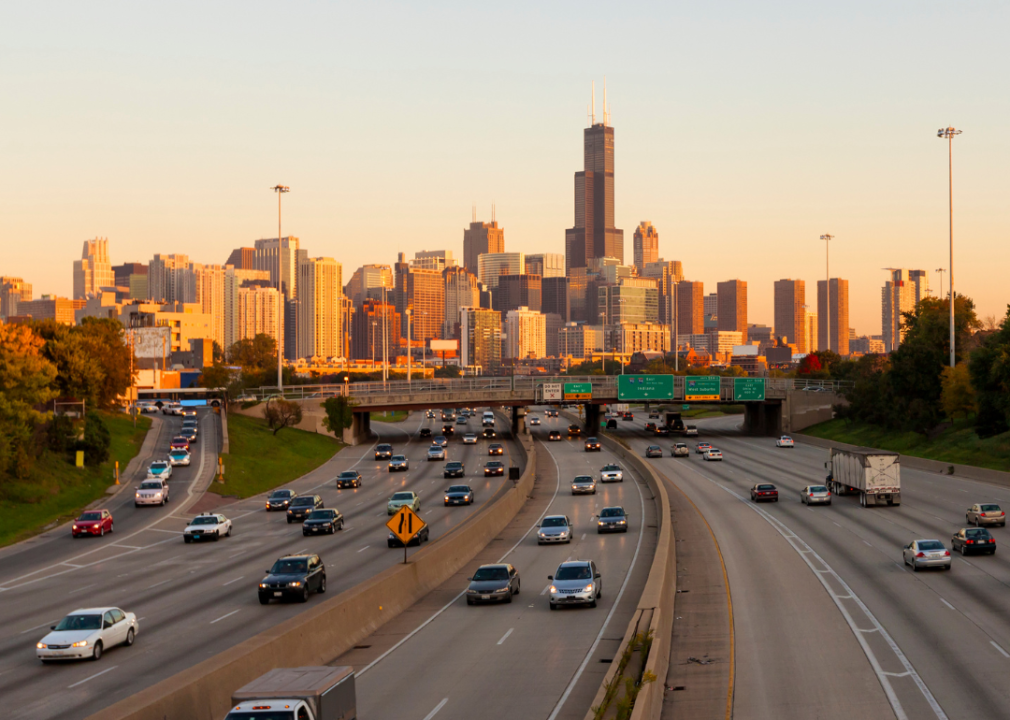
The car has long been a central part of the American lifestyle, a symbol of freedom and mobility. This is reflected in the vast number of miles Americans drive each year. According to the Federal Highway Administration (FHWA), the average American drives roughly 14,000 miles annually. Collectively, this amounts to a staggering 3.3 trillion vehicle miles traveled (VMT) across the nation.

However, a closer look at driving habits reveals significant variations from state to state. Factors like population density, access to public transportation, urban vs. rural geography, and even local culture all influence how much a person drives. While the national average provides a general benchmark, the reality is that a driver in Wyoming has a vastly different experience, and drives a different number of miles, than a driver in New York City.

Which states residents drive the most

CheapInsurance.com, using recent data from the FHWA and the Census Bureau for 2024 and 2025, has analyzed VMT per capita to highlight which states’ residents spend the most time behind the wheel. The following is a breakdown of the key findings.

capitol building, states that drives the most per capita

#51. Washington DC

Annual vehicle-miles driven: 3.25 billion
—Per capita: 4,843.7

new york city, drives the most

#50. New York

Annual vehicle-miles driven: 112.65 billion
—Per capita: 5,724.9

Hawaii, states that drives the most per capita

#49. Hawaii

Annual vehicle-miles driven: 10.48 billion
—Per capita: 7,278.2

rhode island, states that drives the most per capita

#48. Rhode Island

Annual vehicle-miles driven: 8.10 billion
—Per capita: 7,407.7

washington, states that drives the most per capita

#47. Washington

Annual vehicle-miles driven: 59.18 billion
—Per capita: 7,600.6

alaska, has the most drivers

#46. Alaska

Annual vehicle-miles driven: 5.80 billion
—Per capita: 7,902.3

Pennsylvania, states that drives the most per capita

#45. Pennsylvania

Annual vehicle-miles driven: 103.89 billion
—Per capita: 8,008.7

illinois, highway with the most drivers

#44. Illinois

Annual vehicle-miles driven: 101.66 billion
—Per capita: 8,079.8

california, states that drives the most per capita

#43. California

Annual vehicle-miles driven: 319.63 billion
—Per capita: 8,189.5

CURIOUS ABOUT CAR INSURANCE IN CALIFORNIA?

Start your quote now to find the cheapest car insurance in California.

connecticut, states that drives the most per capita

#42. Connecticut

Annual vehicle-miles driven: 30.40 billion
—Per capita: 8,383.7

new jersey, a lot of drivers in the state

#41. New Jersey

Annual vehicle-miles driven: 78.62 billion
—Per capita: 8,488.2

oregon, states that drives the most per capita

#40. Oregon

Annual vehicle-miles driven: 36.49 billion
—Per capita: 8,606.8

nevada, traffic in Nevada

#39. Nevada

Annual vehicle-miles driven: 27.54 billion
—Per capita: 8,666.1

Massachusetts, states that drives the most per capita

#38. Massachusetts

Annual vehicle-miles driven: 62.12 billion
—Per capita: 8,897.6

west virginia, highway of traffic

#37. West Virginia

Annual vehicle-miles driven: 16.35 billion
—Per capita: 9,211.6

maryland, states that drives the most per capita

#36. Maryland

Annual vehicle-miles driven: 57.68 billion
—Per capita: 9,355.9

colorado, states that drives the most per capita

#35. Colorado

Annual vehicle-miles driven: 54.67 billion
—Per capita: 9,361.6

virginia, states that drives the most per capita

#34. Virginia

Annual vehicle-miles driven: 83.20 billion
—Per capita: 9,580.9

ohio, places with a lot of drivers

#33. Ohio

Annual vehicle-miles driven: 113.94 billion
—Per capita: 9,692.2

new hampshire, drivers

#32. New Hampshire

Annual vehicle-miles driven: 13.61 billion
—Per capita: 9,753.9

delaware, states that drives the most per capita

#31. Delaware

Annual vehicle-miles driven: 10.02 billion
—Per capita: 9,839.0

michigan, states with a lot of drivers

#30. Michigan

Annual vehicle-miles driven: 99.17 billion
—Per capita: 9,883.6

texas, states that drives the most per capita

#29. Texas

Annual vehicle-miles driven: 299.85 billion
—Per capita: 9,985.0

idaho, states that drives the most per capita

#28. Idaho

Annual vehicle-miles driven: 19.47 billion
—Per capita: 10,043.2

minnesota, states that drives the most per capita

#27. Minnesota

Annual vehicle-miles driven: 57.78 billion
—Per capita: 10,106.9

utah, states that drives the most per capita

#26. Utah

Annual vehicle-miles driven: 34.35 billion
—Per capita: 10,161.5

iowa, states that drives the most per capita

#25. Iowa

Annual vehicle-miles driven: 33.15 billion
—Per capita: 10,356.1

arizona, highway with the most drivers

#24. Arizona

Annual vehicle-miles driven: 77.38 billion
—Per capita: 10,514.5

florida, states that drives the most per capita

#23. Florida

Annual vehicle-miles driven: 234.29 billion
—Per capita: 10,532.4

CAR INSURANCE IN THE SUNSHINE STATE

Get a free quote to find the cheapest car insurance in Florida with different levels of coverage today.

nebraska, states where there are the most drivers

#22. Nebraska

Annual vehicle-miles driven: 20.86 billion
—Per capita: 10,598.5

south dakota, states that drives the most per capita

#21. South Dakota

Annual vehicle-miles driven: 9.75 billion
—Per capita: 10,718.6

vermont, states that drives the most per capita

#20. Vermont

Annual vehicle-miles driven: 6.97 billion
—Per capita: 10,774.8

maine, states that drives the most per capita

#19. Maine

Annual vehicle-miles driven: 14.93 billion
—Per capita: 10,780.0

kansas, states that drives the most per capita

#18. Kansas

Annual vehicle-miles driven: 31.67 billion
—Per capita: 10,782.2

kentucky, states that drives the most per capita

#17. Kentucky

Annual vehicle-miles driven: 50.26 billion
—Per capita: 11,138.4

north carolina, states that drives the most per capita

#16. North Carolina

Annual vehicle-miles driven: 119.59 billion
—Per capita: 11,178.1

wisconsin, states that drives the most per capita

#15. Wisconsin

Annual vehicle-miles driven: 65.88 billion
—Per capita: 11,179.9

oklahoma, states that drives the most per capita

#14. Oklahoma

Annual vehicle-miles driven: 45.20 billion
—Per capita: 11,243.3

south carolina, states that drives the most per capita

#13. South Carolina

Annual vehicle-miles driven: 60.26 billion
—Per capita: 11,407.8

georgia, states that drives the most per capita

#12. Georgia

Annual vehicle-miles driven: 125.48 billion
—Per capita: 11,498.3

indiana, states with the most drivers

#11. Indiana

Annual vehicle-miles driven: 80.70 billion
—Per capita: 11,810.9

north dakota, states that drives the most per capita

#10. North Dakota

Annual vehicle-miles driven: 9.33 billion
—Per capita: 11,978.0

tennessee, states that drives the most

#9. Tennessee

Annual vehicle-miles driven: 84.72 billion
—Per capita: 12,014.5

montana, states that drives the most per capita

#8. Montana

Annual vehicle-miles driven: 13.53 billion
—Per capita: 12,045.1

louisiana, states that drives the most per capita

#7. Louisiana

Annual vehicle-miles driven: 55.33 billion
—Per capita: 12,054.7

arkansas, states that drive the most

#6. Arkansas

Annual vehicle-miles driven: 38.25 billion
—Per capita: 12,560.3

missouri, states that drives the most per capita

#5. Missouri

Annual vehicle-miles driven: 80.59 billion
—Per capita: 13,045.1

new mexico, states that drives the most per capita

#4. New Mexico

Annual vehicle-miles driven: 27.62 billion
—Per capita: 13,068.4

Mississippi, states that drives the most per capita

#3. Mississippi

Annual vehicle-miles driven: 40.49 billion
—Per capita: 13,771.5

Alabama, states that drives the most per capita

#2. Alabama

Annual vehicle-miles driven: 77.64 billion
—Per capita: 15,300.3

Wyoming, states that drives the most per capita

#1. Wyoming

Annual vehicle-miles driven: 10.69 billion
—Per capita: 18,378.7

Frequently Asked Questions: Driving Per Capita by State

What does “vehicle miles traveled (VMT) per capita” mean?

VMT per capita is the total number of vehicle miles driven in a state over a year, divided by the number of residents. It helps compare how much people drive across states in a way that accounts for population size. This page’s rankings are based on VMT data (FHWA) and population data (U.S. Census Bureau).

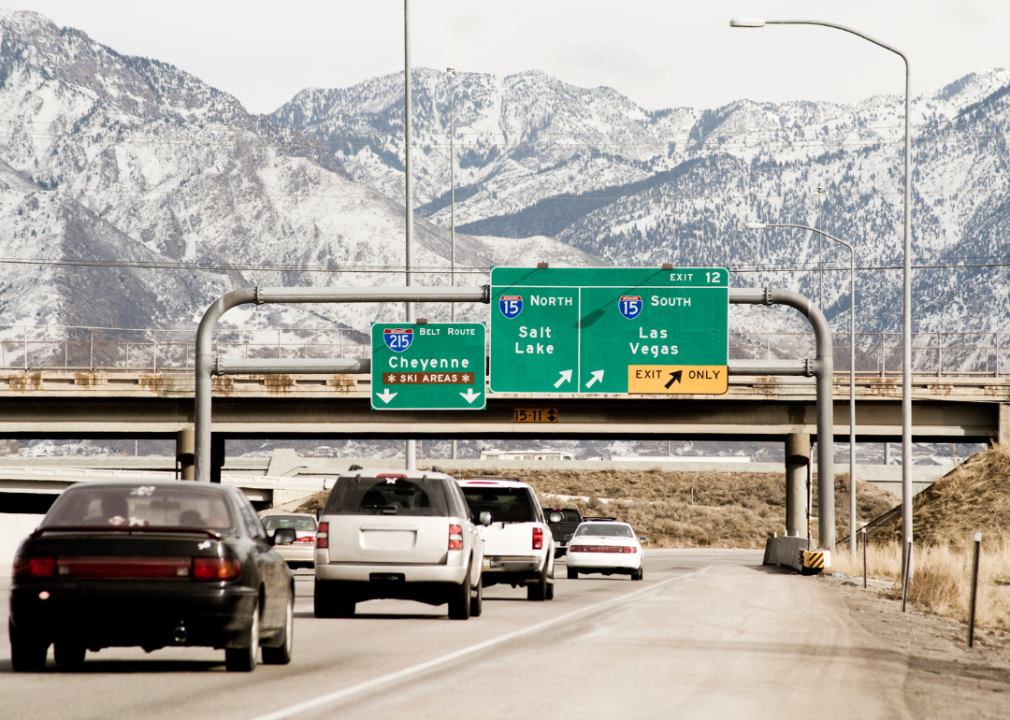
Which states have the highest VMT per capita (drive the most per person)?

Rural, wide-open states tend to rank highest because residents often travel longer distances for work, school, shopping, and services, and public transit is limited. In this analysis, Wyoming ranks #1 for miles driven per person, with states like Alabama and Mississippi also near the top.

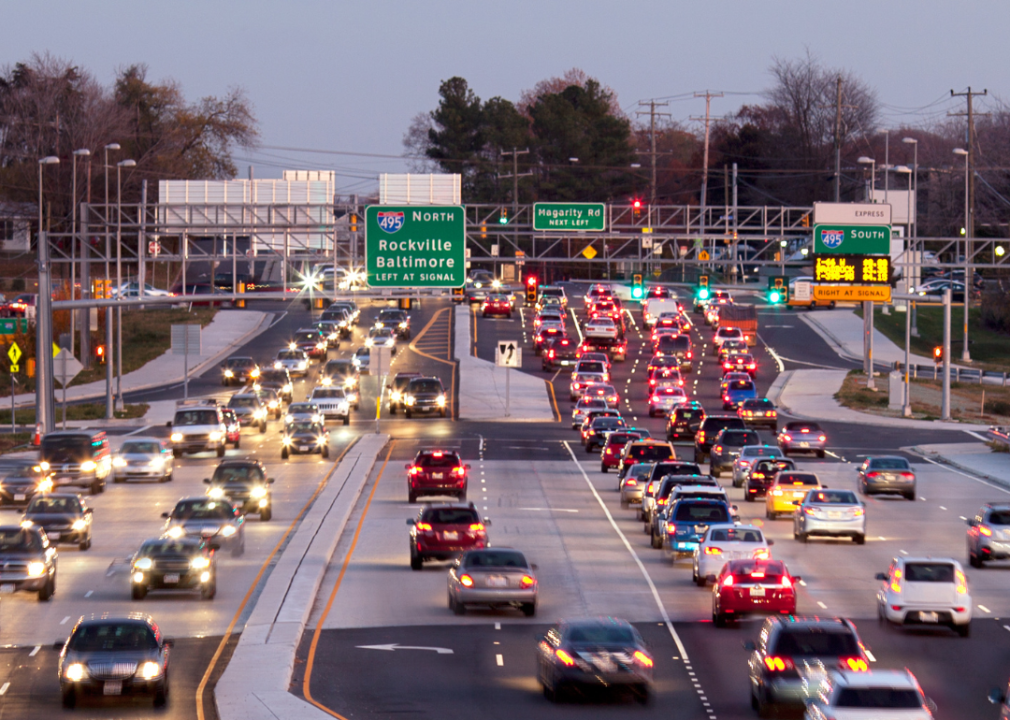
Why do some places have much lower driving per capita?

Areas with dense cities and strong public transportation usually see fewer miles driven per person. Shorter trip distances, more walkable neighborhoods, and more transit options reduce the need to drive. In this analysis, Washington, D.C. ranks lowest for VMT per capita, with states like New York and Hawaii also on the low end.

Story editing by Jeff Inglis. Copy editing by Kristen Wegrzyn. Photo selection by Ania Antecka.

By

Published

September 24, 2025

Reviewed By